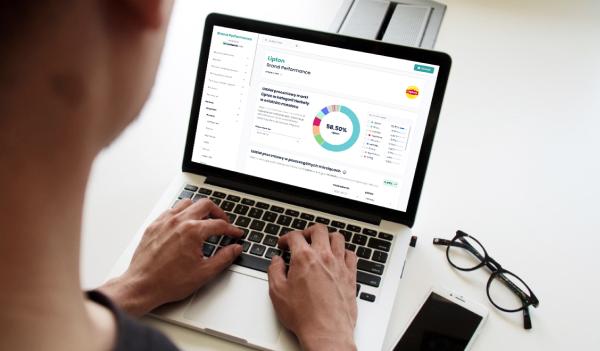
The Pikok brand is monitored in the High-protein frankfurters category.
The category leader is Kraina Wędlin with a 100.00% share.
Its highest monthly share in the period shown, 100.00%, came in September 2026.
Data comes from the shopping lists of Listonic and Moja Gazetka app users and is updated weekly.
SUBCATEGORY CHARTS
Time to store
Shows how much time passes from adding a product from a given subcategory to a shopping list to the moment of purchase10.9 h
High-protein frankfurters
Type Impulse | Up to 36 h
Products purchased quickly after being added to the list, usually at the next shopping opportunity. The decision is made without much planning – the need arises and is acted on almost immediately.Cold cuts, sausages
High-protein kabanos sausages
High-protein frankfurters
Plant-based meat
Kabanos sausages
Frankfurters
0 h
0 h
10.9 h
16.1 h (1 day)
58.8 h (2 days)
64.4 h (3 days)
Median of the Meat, fish and products category: 81.3 h (3 days)
Plant-based cold cuts
Fish and fish products
Poultry
Tofu
98.3 h (4 days)
103.9 h (4 days)
104.4 h (4 days)
108.7 h (5 days)
| Subcategory | RPR (%) |
|---|---|
| High-protein frankfurters | 97% |
| Tofu | 95% |
| Kabanos sausages | 95% |
| Frankfurters | 95% |
| Plant-based cold cuts | 94% |
| Poultry | 92% |
| Fish and fish products | 91% |
| Cold cuts, sausages | 82% |
| High-protein kabanos sausages | 80% |
| Plant-based meat | 72% |
Real Purchase Rate (RPR)
The formula for calculating RPR
RPR =
Number of products marked as boughtNumber of products added to the list
x 100%| Miesiąc | BLI (%) |
|---|---|
| 2024-10-01T00:00:00 | 71.83% |
| 2024-11-01T00:00:00 | 100.00% |
| 2024-12-01T00:00:00 | 93.75% |
| 2025-01-01T00:00:00 | 100.00% |
| 2025-02-01T00:00:00 | 90.48% |
| 2025-03-01T00:00:00 | 63.16% |
| 2025-04-01T00:00:00 | 16.67% |
| 2025-05-01T00:00:00 | 32.00% |
| 2025-06-01T00:00:00 | 28.57% |
| 2025-07-01T00:00:00 | 3.23% |
| 2025-08-01T00:00:00 | 15.38% |
| 2025-09-01T00:00:00 | 24.44% |
| 2025-10-01T00:00:00 | 18.92% |
| 2025-11-01T00:00:00 | 5.71% |
| 2025-12-01T00:00:00 | 0.00% |
| 2026-01-01T00:00:00 | 63.75% |
| 2026-02-01T00:00:00 | 44.12% |
| 2026-03-01T00:00:00 | 7.69% |
| 2026-04-01T00:00:00 | 4.76% |
| 2026-05-01T00:00:00 | 0.00% |
| 2026-06-01T00:00:00 | 26.92% |
| 2026-07-01T00:00:00 | 0.00% |
| 2026-08-01T00:00:00 | 0.00% |
| 2026-09-01T00:00:00 | 0.00% |
-71.80%
The indicator shows the difference between the last and first month within a selected range
BLI - Brand Loyalty Index
The formula for calculating BLI
BLI =
Number of additions High-protein frankfurters with the brandAll additions High-protein frankfurters
x 100%Show data up to:
Range:
| Miesiąc | Dodania z marką | Wszystkie dodania z kategorii |
|---|---|---|
| 2024-10-01T00:00:00 | 51 | 71 |
| 2024-11-01T00:00:00 | 39 | 39 |
| 2024-12-01T00:00:00 | 15 | 16 |
| 2025-01-01T00:00:00 | 83 | 83 |
| 2025-02-01T00:00:00 | 38 | 42 |
| 2025-03-01T00:00:00 | 12 | 19 |
| 2025-04-01T00:00:00 | 3 | 18 |
| 2025-05-01T00:00:00 | 8 | 25 |
| 2025-06-01T00:00:00 | 6 | 21 |
| 2025-07-01T00:00:00 | 1 | 31 |
| 2025-08-01T00:00:00 | 4 | 26 |
| 2025-09-01T00:00:00 | 11 | 45 |
| 2025-10-01T00:00:00 | 7 | 37 |
| 2025-11-01T00:00:00 | 2 | 35 |
| 2025-12-01T00:00:00 | 0 | 23 |
| 2026-01-01T00:00:00 | 51 | 80 |
| 2026-02-01T00:00:00 | 30 | 68 |
| 2026-03-01T00:00:00 | 2 | 26 |
| 2026-04-01T00:00:00 | 2 | 42 |
| 2026-05-01T00:00:00 | 0 | 46 |
| 2026-06-01T00:00:00 | 21 | 78 |
| 2026-07-01T00:00:00 | 0 | 19 |
| 2026-08-01T00:00:00 | 22 | 0 |
| 2026-09-01T00:00:00 | 31 | 0 |
Additions of a product from category High-protein frankfurters
The method of counting additions changed in June 2026 – comparisons with periods before that date may not be fully reliable.
Show data up to:
Range:
Number of additions High-protein frankfurters
Number of additions High-protein frankfurters with the brand
The data for the analysis comes from shopping lists in Listonic and Moja Gazetka. The study has been supplemented with data from Moja Gazetka since October 2024.From June 2026 the method of counting additions has been refined: re-marking a product as to buy after it was previously checked off as bought (an "uncheck") now also counts as an addition to the list. This change affects data from June 2026 onwards – worth bearing in mind when comparing with earlier periods.
Is your brand missing from the comparison?

Want to increase your sales?Contact us

Stay up to date in the FMCG industry and shopping apps.Learn more with our newsletter.Subscribe to the newsletter